
Endangered Languages
An atlas of languages at risk, for diaspora families and people working to keep their language alive. A globe shows the 1,495 languages Glottolog rates moribund, nearly extinct or extinct, and extinct languages turn into hollow rings in the year they were last recorded.
For Irish and Hawaiian, a timeline traces speaker counts from census records alongside the events around them, and marks the gaps where the record is missing. Families can add text, photos and voice recordings to a year or a gap, and confirm or correct AI-suggested causes for a decline.
The brief was to design a product that a specific group of people would love, centered on the theme of storytelling. We flipped it: instead of building a new way to tell stories, we asked how storytelling could be protected.
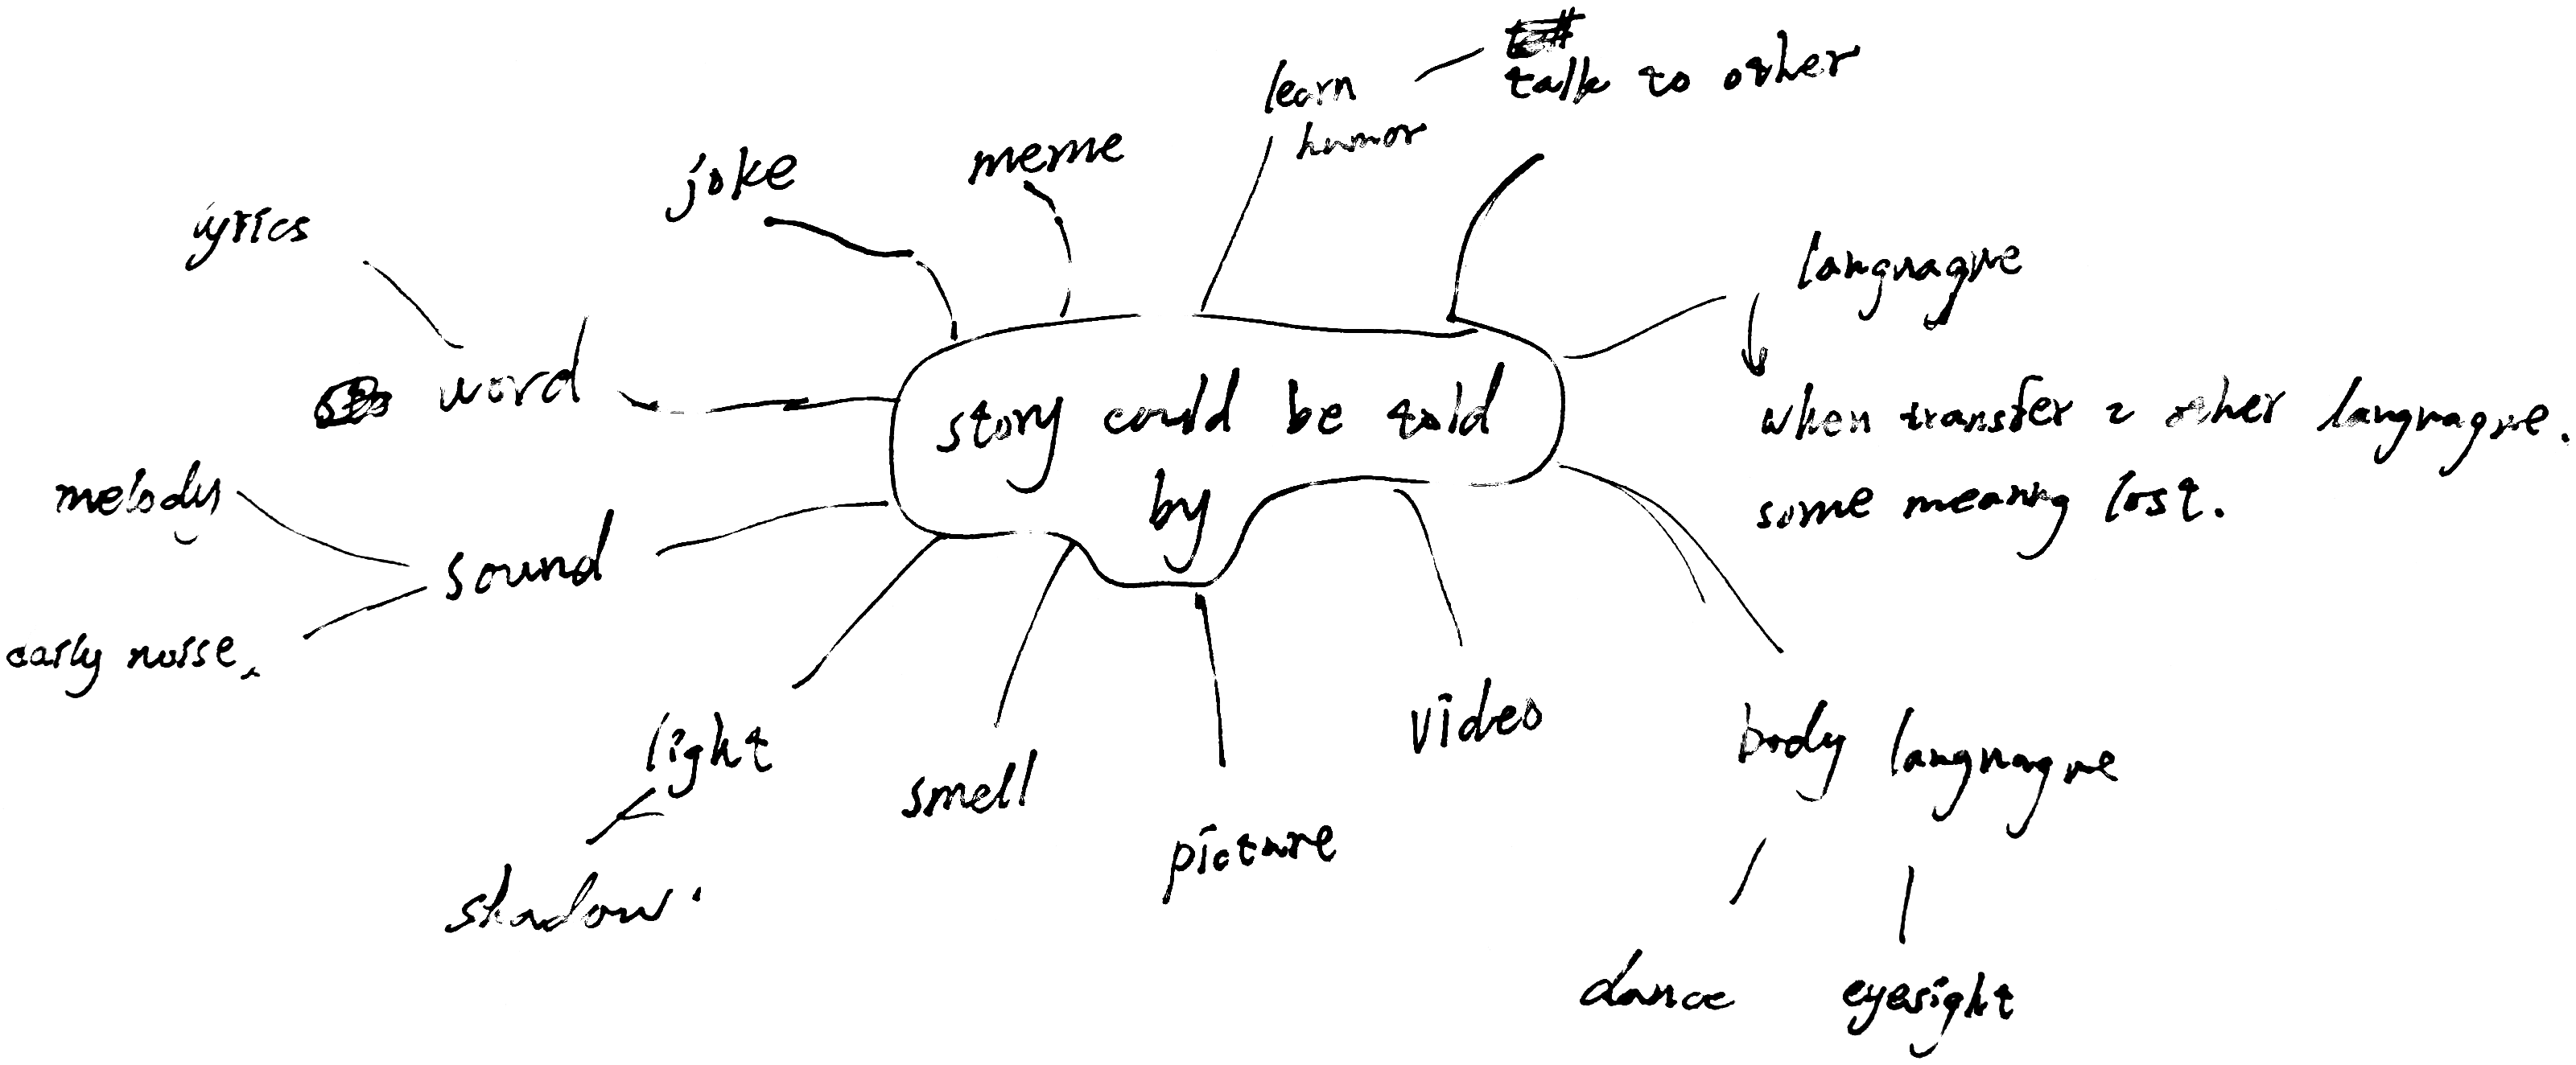
Our first brainstorming session started with the word storytelling, and one branch kept pulling us back: when a story moves into another language, some of its meaning is lost. Where one language dominates, the winner takes it all. Its speakers become the tellers of history, and other cultures are erased. In Germany, I saw regional dialects that are now spoken mostly by elderly people, and accents and dialects everywhere are fading with the internet. These languages need to be documented, with original materials in them, so future generations can understand what happened.
The first problem was data visualization: how to map change over time using data from many different sources, such as national censuses and local surveys. We focused on languages rated moribund, nearly extinct or extinct.
I designed the look of the site and knew it should be minimal. Every language is a dot on the globe that you can hover over, so you can discover languages you didn’t know about, and search lets you find a specific one. We couldn’t tell every story, so we started with Ireland and Hawaiʻi, which both have a lot of historical data documenting how their languages changed.
Zoomed in, each place had to show several languages at once, so we kept the same dot system and changed only the colors. The colors took many rounds: they had to be bright enough to tell apart at a glance, while still feeling tasteful.
At first, when you zoomed into a place, we interpolated between solid data points, such as two censuses. I wasn’t sure about the ethics of this. In the age of AI, is it acceptable to fill in numbers nobody counted? I showed it to our professor, who specializes in data visualization, and he helped me reframe the question: there is no need to interpolate, just represent what is available.
I knew I wanted a timeline so you could see the changes over time. Instead of interpolating, the timeline now marks only the years where real data exists, and jumps from one count to the next. It is less smooth, but the jumps tell the story themselves.
We also needed to show historical events on the timeline, so you could see how they might line up with a decline or rise in speakers. At first we had two separate timelines, one for counts and one for events, but that was very confusing. Feedback pushed us to merge them into one, and to tell the two apart we used dots for counts and diamonds for events.
We also iterated a lot on what data to show. In the beginning we included everything but the kitchen sink, and had to distill it down to the most critical information. That left a simple graph of a language’s speakers over time, an estimate of how many people spoke it in a given year, and a short description.
With the data in place, the site still felt like it was missing the personal touch we set out to give it. Our premise was that the dominant language tells the story, and leaving communities out would only reinforce that. So we added community artifacts, so that members can show what their language means to them in their own words. They can share things that never made it into historical archives, and the site keeps a log of that perspective alongside the official record.
We kept iterating, and the storytelling still felt a little weak. The final site combines the data with a few key interactions, moving from the whole world down to one family’s story.
Clicking a place opens a screen before any data, then fades into the map once the recording ends. It shows a photo of a speaker and a proverb in the language with its translation, and plays a recording of a native speaker reading it. For Hawaiian, the proverb is “I ka ʻōlelo nō ke ola; i ka ʻōlelo nō ka make”: in language there is life; in language there is death.
Seeing the people and hearing the sound of the language helps you connect with it before you reach the data visualization. The voice note’s waveform is drawn in dots to keep the site’s visual identity, and it is generated from the recording itself, so it follows what the speaker is actually saying.
Zoomed in, every dot on the map stands for speakers of a language. Hovering over the map shows the area, the share of people who spoke the language that year, and whether that number was counted or estimated.
The timeline stops only on years with a real count. Dots are counts, diamonds are events such as the 1896 law that made English the only language of instruction, and hatched spans mark gaps in the record. The arrow keys move between them, and the panel updates the speaker estimate and graph for each year.
“Read the story” opens a scrolling, parallax history of the language built from archival material. For Hawaiian, it moves through an 1885 survey map of Maui, where the survey’s grid cuts across the Hawaiian way of dividing land from the mountains down to the sea, the 1896 English-only law, and the 1897 petition against annexation, which you can add your name to. It ends with a song you can listen to and then sing back.
Every endangered language is a dot on the globe, so you can discover languages you didn’t know about, and search finds a specific one.
Community members can add text, photos and voice recordings to a year or a gap in the record, and confirm or correct AI-suggested causes for a decline.